AMWG Diagnostics Package
b40.prescribed_carb.001

Fri Jun 25 16:23:15 MDT 2010
AMWG Diagnostics Package b40.prescribed_carb.001 |
|
Plots Created Fri Jun 25 16:23:15 MDT 2010 |
|---|
|
Set
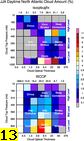
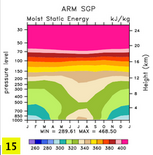
Description 1 Tables of ANN, DJF, JJA, global and regional means and RMSE. 2 Line plots of annual implied northward transports. 3 Line plots of DJF, JJA and ANN zonal means 4 Vertical contour plots of DJF, JJA and ANN zonal means 4a Vertical (XZ) contour plots of DJF, JJA and ANN meridional means 5 Horizontal contour plots of DJF, JJA and ANN means 6 Horizontal vector plots of DJF, JJA and ANN means 7 Polar contour and vector plots of DJF, JJA and ANN means 8 Annual cycle contour plots of zonal means 9 Horizontal contour plots of DJF-JJA differences 10 Annual cycle line plots of global means 11 Pacific annual cycle, Scatter plot plots 12 Vertical profile plots from 17 selected stations 13 ISCCP cloud simulator plots 14 Taylor Diagram plots 15 Annual Cycle at Select Stations plots 
 TABLES METRICS |
Click on Plot Type
|
|---|