b40.rcp2_6.1deg.005
and
b30.036a
DIAG Sets 5 & 6 - Horizontal contour/vector plots of DJF, JJA and ANN means
Surface Variables
DJF
JJA
ANN
ALBSURF
Albedo at surface
plot
plot
plot
PBLH
Planetary boundary layer height
plot
plot
plot
PS
Surface pressure
plot
plot
plot
PSL *
Sea level pressure
plot
plot
plot
TREFHT *
2-meter air temperature
plot
plot
plot
TS *
Surface temperature
plot
plot
plot
SST
Sea Surface temperature
plot
plot
plot
Vector Variables
DJF
JJA
ANN
SURF STRESS *
Surface wind stress (ocean)
plot
plot
plot
SURF STRESS TROP
Tropical surface wind stress (ocean)
plot
plot
plot
SURF WIND
Near surface wind
plot
plot
plot
Constant Pressure Levels
DJF
JJA
ANN
CHI 200 *
200 mb velocity potential
plot
plot
plot
EKE 850 *
850 mb transient eddy kinetic energy
plot
plot
plot
PSI 200 *
200 mb stream function
plot
plot
plot
TTRP
Tropopause temperature
plot
plot
plot
T 850 *
850 mb temperature
plot
plot
plot
T 200
200 mb temperature
plot
plot
plot
U 200 *
200 mb zonal wind
plot
plot
plot
VT 850 *
850 mb meridional heat transport
plot
plot
plot
Z 500
500 mb geopotential height
plot
plot
plot
Z 300 *
300 mb geopotential height
plot
plot
plot
Hydrologic Cycle
DJF
JJA
ANN
EP *
Evaporation - precipitation
plot
plot
plot
PRECIP
Cumulative precipitation
plot
plot
plot
PRECT *
Precipitation rate
plot
plot
plot
PRECT TROP
Tropical precipitation rate
plot
plot
plot
PREH2O *
Total precipitable water
plot
plot
plot
PREH2O TROP
Tropical total precipitable water
plot
plot
plot
QFLX
Surface water flux
plot
plot
plot
Surface Energy Fluxes
DJF
JJA
ANN
FLDS
Longwave downwelling flux
plot
plot
plot
FLDSC
Clearsky longwave downwelling flux
plot
plot
plot
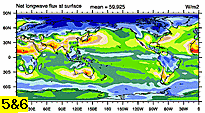
FLNS *
Net longwave flux
plot
plot
plot
FLNSC
Clearsky net longwave flux
plot
plot
plot
FSDS *
Shortwave downwelling flux
plot
plot
plot
FSNS *
Net shortwave flux
plot
plot
plot
FSNS TROP
Tropical net shortwave flux
plot
plot
plot
FSNSC
Clearsky net shortwave flux
plot
plot
plot
LHFLX *
Latent heat flux
plot
plot
plot
RESSURF *
Residual energy flux
plot
plot
plot
RESSURF TROP
Tropical residual energy flux
plot
plot
plot
SHFLX *
Sensible heat flux
plot
plot
plot
Top of Model Energy Fluxes
DJF
JJA
ANN
ALBEDO
TOA albedo
plot
plot
plot
ALBEDOC
TOA clearsky albedo
plot
plot
plot
FLNT *
Net longwave flux
plot
plot
plot
FLNTC
Clearsky net longwave flux
plot
plot
plot
FSNT *
Net shortwave flux
plot
plot
plot
FSNTC
Clearsky net shortwave flux
plot
plot
plot
LWCF *
Longwave cloud forcing
plot
plot
plot
SOLIN
Incoming solar radiation
plot
plot
plot
SWCF *
Shortwave cloud forcing
plot
plot
plot
SWCF TROP
Tropical shortwave cloud forcing
plot
plot
plot
Cloud Variables
DJF
JJA
ANN
CLDHGH
High-level cloud amount
plot
plot
plot
CLDLOW
Low-level cloud amount
plot
plot
plot
CLDMED
Mid-level cloud amount
plot
plot
plot
CLDTOT *
Total cloud amount
plot
plot
plot
TGCLDIWP
Total grid-box cloud ice water path
plot
plot
plot
TGCLDLWP
Total grid-box cloud liquid water path
plot
plot
plot
TGCLDLWP TROP
Tropical Total grid-box cloud LWP
plot
plot
plot
TICLDIWP
Integrated in-cloud ice WP
plot
plot
plot
TICLDLIQWP
Integrated in-cloud liquid WP
plot
plot
plot
TICLDTWP
Integrated in-cloud ice+liquid WP
plot
plot
plot
ISCCP Cloud Simulator
DJF
JJA
ANN
MEANPTOP
Mean Cloud Top Pressure
plot
plot
plot
MEANTTOP
Mean Cloud Top Temperature
plot
plot
plot
MEANTAU
Mean Cloud Optical Thickness
plot
plot
plot
TCLDAREA
Total cloud area
plot
plot
plot
Aerosols
DJF
JJA
ANN
AODVIS
Aerosol Optical Depth
plot
plot
plot
*WGNE diagnostic variable