newsstclim06 compared with the official CCM3.6.16 AMIP2 simulation (only for 1979 through 1992)
| Set | Description |
|---|---|
| 1 | Tables of ANN, DJF, JJA, global and regional means and RMSE. |
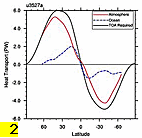
| 2 | Line plots of annual implied northward transports. |
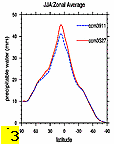
| 3 | Line plots of DJF, JJA and ANN zonal means |
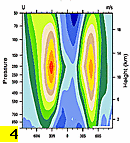
| 4 | Vertical contour plots of DJF, JJA and ANN zonal means |
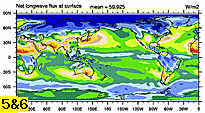
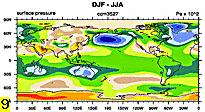
| 5 | Horizontal contour plots of DJF, JJA and ANN means |
| 6 | Horizontal vector plots of DJF, JJA and ANN means |
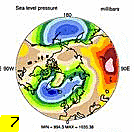
| 7 | Polar contour and vector plots of DJF, JJA and ANN means |
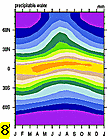
| 8 | Annual cycle contour plots of zonal means |
| 9 | Horizontal contour plots of DJF-JJA differences |
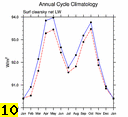
| 10 | Annual cycle line plots of global means |
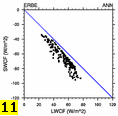
| 11 | Miscellaneous plot types |
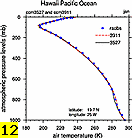
| 12 | Vertical profile plots from 17 selected stations |
Click on Plot Type