WAWG Research Highlights
WACCM Simulates the Global Volcanic Aerosol, 1990-2014
WACCM Simulates the Global Environmental Effects of a Regional Nuclear War
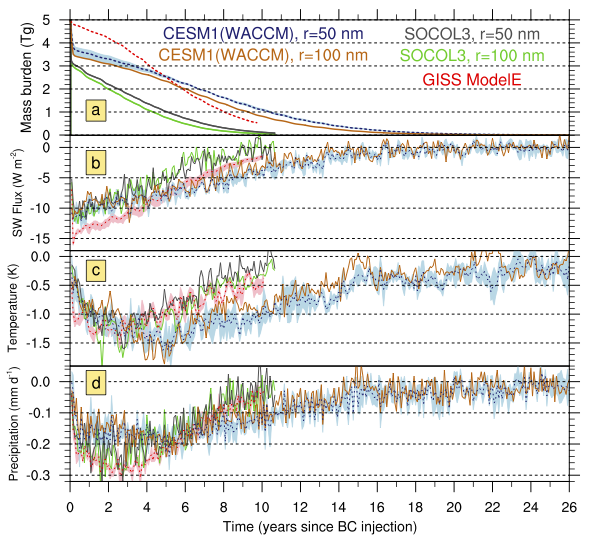
A regional nuclear conflict between India and Pakistan would not only inflict immediate damage in the subcontinent, including massive loss of life and destruction of built infrastructure; severe long-term environmental damage would also spread globally, lasting decades, researchers have found. In a paper published in the AGU journal Earth’s Future, NCAR Atmospheric Chemistry Division project scientists Michael Mills and Julia Lee-Taylor and their colleagues present the first study of such a scenario to use an Earth system model including coupled interactions between atmospheric chemistry and dynamics, ocean dynamics, sea ice and land components. They studied a scenario in which India and Pakistan each detonate 50 small nuclear weapons, about half of their current arsenals, in modern megacities, igniting fires that would build for hours after the explosions. The fires would build into firestorms consuming buildings, vegetation, roads, fuel depots, and other infrastructure, releasing energy many times that of the weapon’s yield, generating 5 Tg of smoke in the form of black carbon (BC).
Calculations using version 1.0 of the Community Earth System Model (CESM1), with the Whole Atmosphere Community Climate Model (WACCM) show that the BC would self-loft to the stratosphere, where it would spread globally, producing the coldest average surface temperatures in the last 1000 years. Killing frosts would reduce growing seasons by 10-40 days per year for 5 years. The figure shows how CESM1(WACCM) calculates that the BC would remain in the stratosphere (panel a) reducing solar fluxes to the surface (panel b) for nearly 2 decades, much longer than previous studies of the same scenario with other models, due to interaction of the radiation, chemistry, and dynamics calculated in the coupled model. Surface temperatures (panel c) and precipitation (panel d) would be reduced for more than 25 years, due to thermal inertia and albedo effects in the ocean and expanded sea ice. Previous studies did not include both full ocean dynamics and atmospheric chemistry, and found that these disruptive effects on surface climate would last about 10 years.
At the same time, intense heating of the stratosphere would cause global ozone losses of 20%-50% over populated areas, levels unprecedented in human history. The authors calculate summer enhancements in damaging ultraviolet radiation of 30%-80% over mid-latitudes, suggesting widespread damage to human health, agriculture, and terrestrial and aquatic ecosystems. The combined cooling and enhanced UV would put significant pressures on global food supplies and could trigger a global nuclear famine. The 100 relatively small nuclear bombs in the study represent just a small fraction of the world’s approximately 17,000 nuclear weapons.
Reference: Mills, M. J., O. B. Toon, J. Lee-Taylor, and A. Robock (2014), Multi-decadal global cooling and unprecedented ozone loss following a regional nuclear conflict, Earth's Future, doi:10.1002/2013EF000205.
Using WACCM to Investigate the Influence of Stratospheric Ozone Loss on Trends in Sea Ice
The NCAR Community Earth System Model (CESM) system is facilitating the investigation of the interactions among different components of the earth-atmospheric system. One of the available atmospheric models is WACCM (Whole Atmosphere Community Climate Model), which was specifically developed to simulate interactions between chemistry and climate across all levels of the atmosphere. WACCM simulations are particularly valuable in exploring the impact of middle atmosphere dynamics and chemistry on the climate system. Using WACCM we compared multiyear simulations of recent decades to similar simulations using CCSM4, which has a less interactive stratosphere because its upper boundary is lower and it does not include interactive ozone chemistry. The differences are not limited to the stratosphere but instead extend through the climate system. The high southern latitudes are a particular example because of the radiative and dynamical impact of the seasonal Antarctic ozone hole. The comparisons, shown in the figure, indicate that the extent of sea ice around Antarctica is lower in the WACCM simulations. In panel b, it is evident that the magnitude of trend in ice extent simulated by WACCM has been substantially stronger in the years since the onset of the Antarctic ozone hole.
Reference: Marsh, D. R., M.J. Mills, D.E. Kinnison, J.-F. Lamarque, N. Calvo, and L. M. Polvani, Climate change from 1850 to 2005 simulated in CESM1(WACCM), 73727391, Journal of Climate 26 (19), doi:10.1175/JCLI-D-12-00558.1, 2013.

Investigation of Stratospheric Sulfate Aerosol Trends using the Whole Atmosphere Community Climate Model (WACCM)
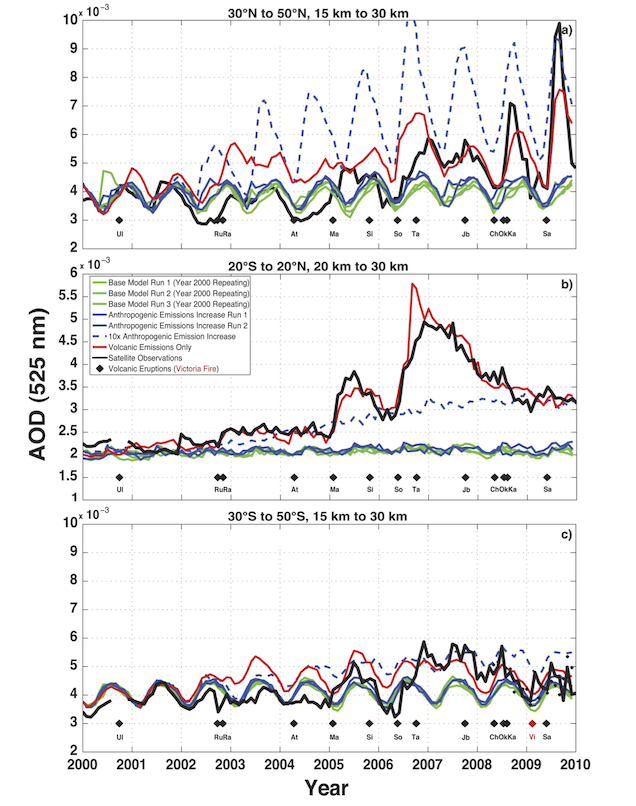
The NCAR Community Earth System Model (CESM) system is facilitating the investigation of the interactions among different components of the earth-atmospheric system. One of the available atmospheric models is WACCM (Whole Atmosphere Community Climate Model), which was specifically developed to simulate interactions between chemistry and climate across all levels of the atmosphere. WACCM is particularly well suited to studies of the evolution and climate impacts of the stratospheric sulfate aerosol layer, which observations show increased by 4-10% per year between 2000 and 2010. This increase in aerosol, which scatters sunlight back to space, has been suggested as a factor in the reduced rate of global warming observed during the same period. Using WACCM with a new prognostic representation of stratospheric aerosol based on emissions, we showed that moderate volcanic eruptions known to have occurred during this period are the primary source of this increase, while anthropogenic sulfur pollution increased at one-tenth of the magnitude needed to account for the stratospheric trend. We have recently applied this new capability in WACCM to the 2011 eruption of the Nabro volcano in Eritrea, showing how it input the largest increase in stratospheric aerosol in 20 years in part via a previously unknown entry mechanism involving the Asian monsoon. We continue to develop these capabilities to study the impacts on climate, chemistry, and dynamics of historical and future volcanic eruptions, changes in sulfur pollution, and potential future attempts to geoengineer the climate via deliberate enhancement of stratospheric sulfate.
Reference: Neely, R.R., III, O.B. Toon, S. Solomon, J.-P. Vernier, C. Alvarez, J.M. English, K.H. Rosenlof, M.J. Mills, C.G. Bardeen, J.S. Daniel, and J.P. Thayer, Recent anthropogenic increases in SO2 from Asia have minimal impact on stratospheric aerosol, J. Geophys. Res., 40, 999-1004, doi:10.1002/grl.50263, 2013.
WACCM Simulates the Antarctic Ozone Hole
The Montreal Protocol on Substances that Deplete the Ozone Layer and its amendments mandate assessments of the status of atmospheric ozone every four years. A key input to these assessment reports is derived from integrations of models that simulate the past, present, and future chemistry of the ozone layer. Integrations using the whole atmosphere option of the CESM are underway for the upcoming 2014 assessment. This model, known as the Whole Atmosphere Community Climate Model (WACCM), simulates interactive chemistry from the Earth’s surface to above 100 km. The figure compares the total ozone observed above the Halley Bay station in Antarctica with that from two WACCM simulations. The simulations labeled REFC1SD use temperature, wind, and other key meteorological fields determined from analyses of observations; the comparison indicated that the model ozone agrees very well with the observed ozone. In the simulations labeled REFC2, the model itself calculates all the meteorological fields. This free-running model is a much more stringent test of model performance because the chemistry is quite sensitive to the atmospheric temperature and the temperature in turn is sensitive to ozone and to various aspects of the model dynamics. The figure indicates that the interactive WACCM integration REFC2 does an excellent job in showing the development of the Antarctic ozone hole over the period 1950-2010. This is a marked improvement over previous versions of the model, which tended to be too cold in Southern Hemisphere spring. Such free-running models are necessary for predictions of the ozone recovery over the coming decades.
